

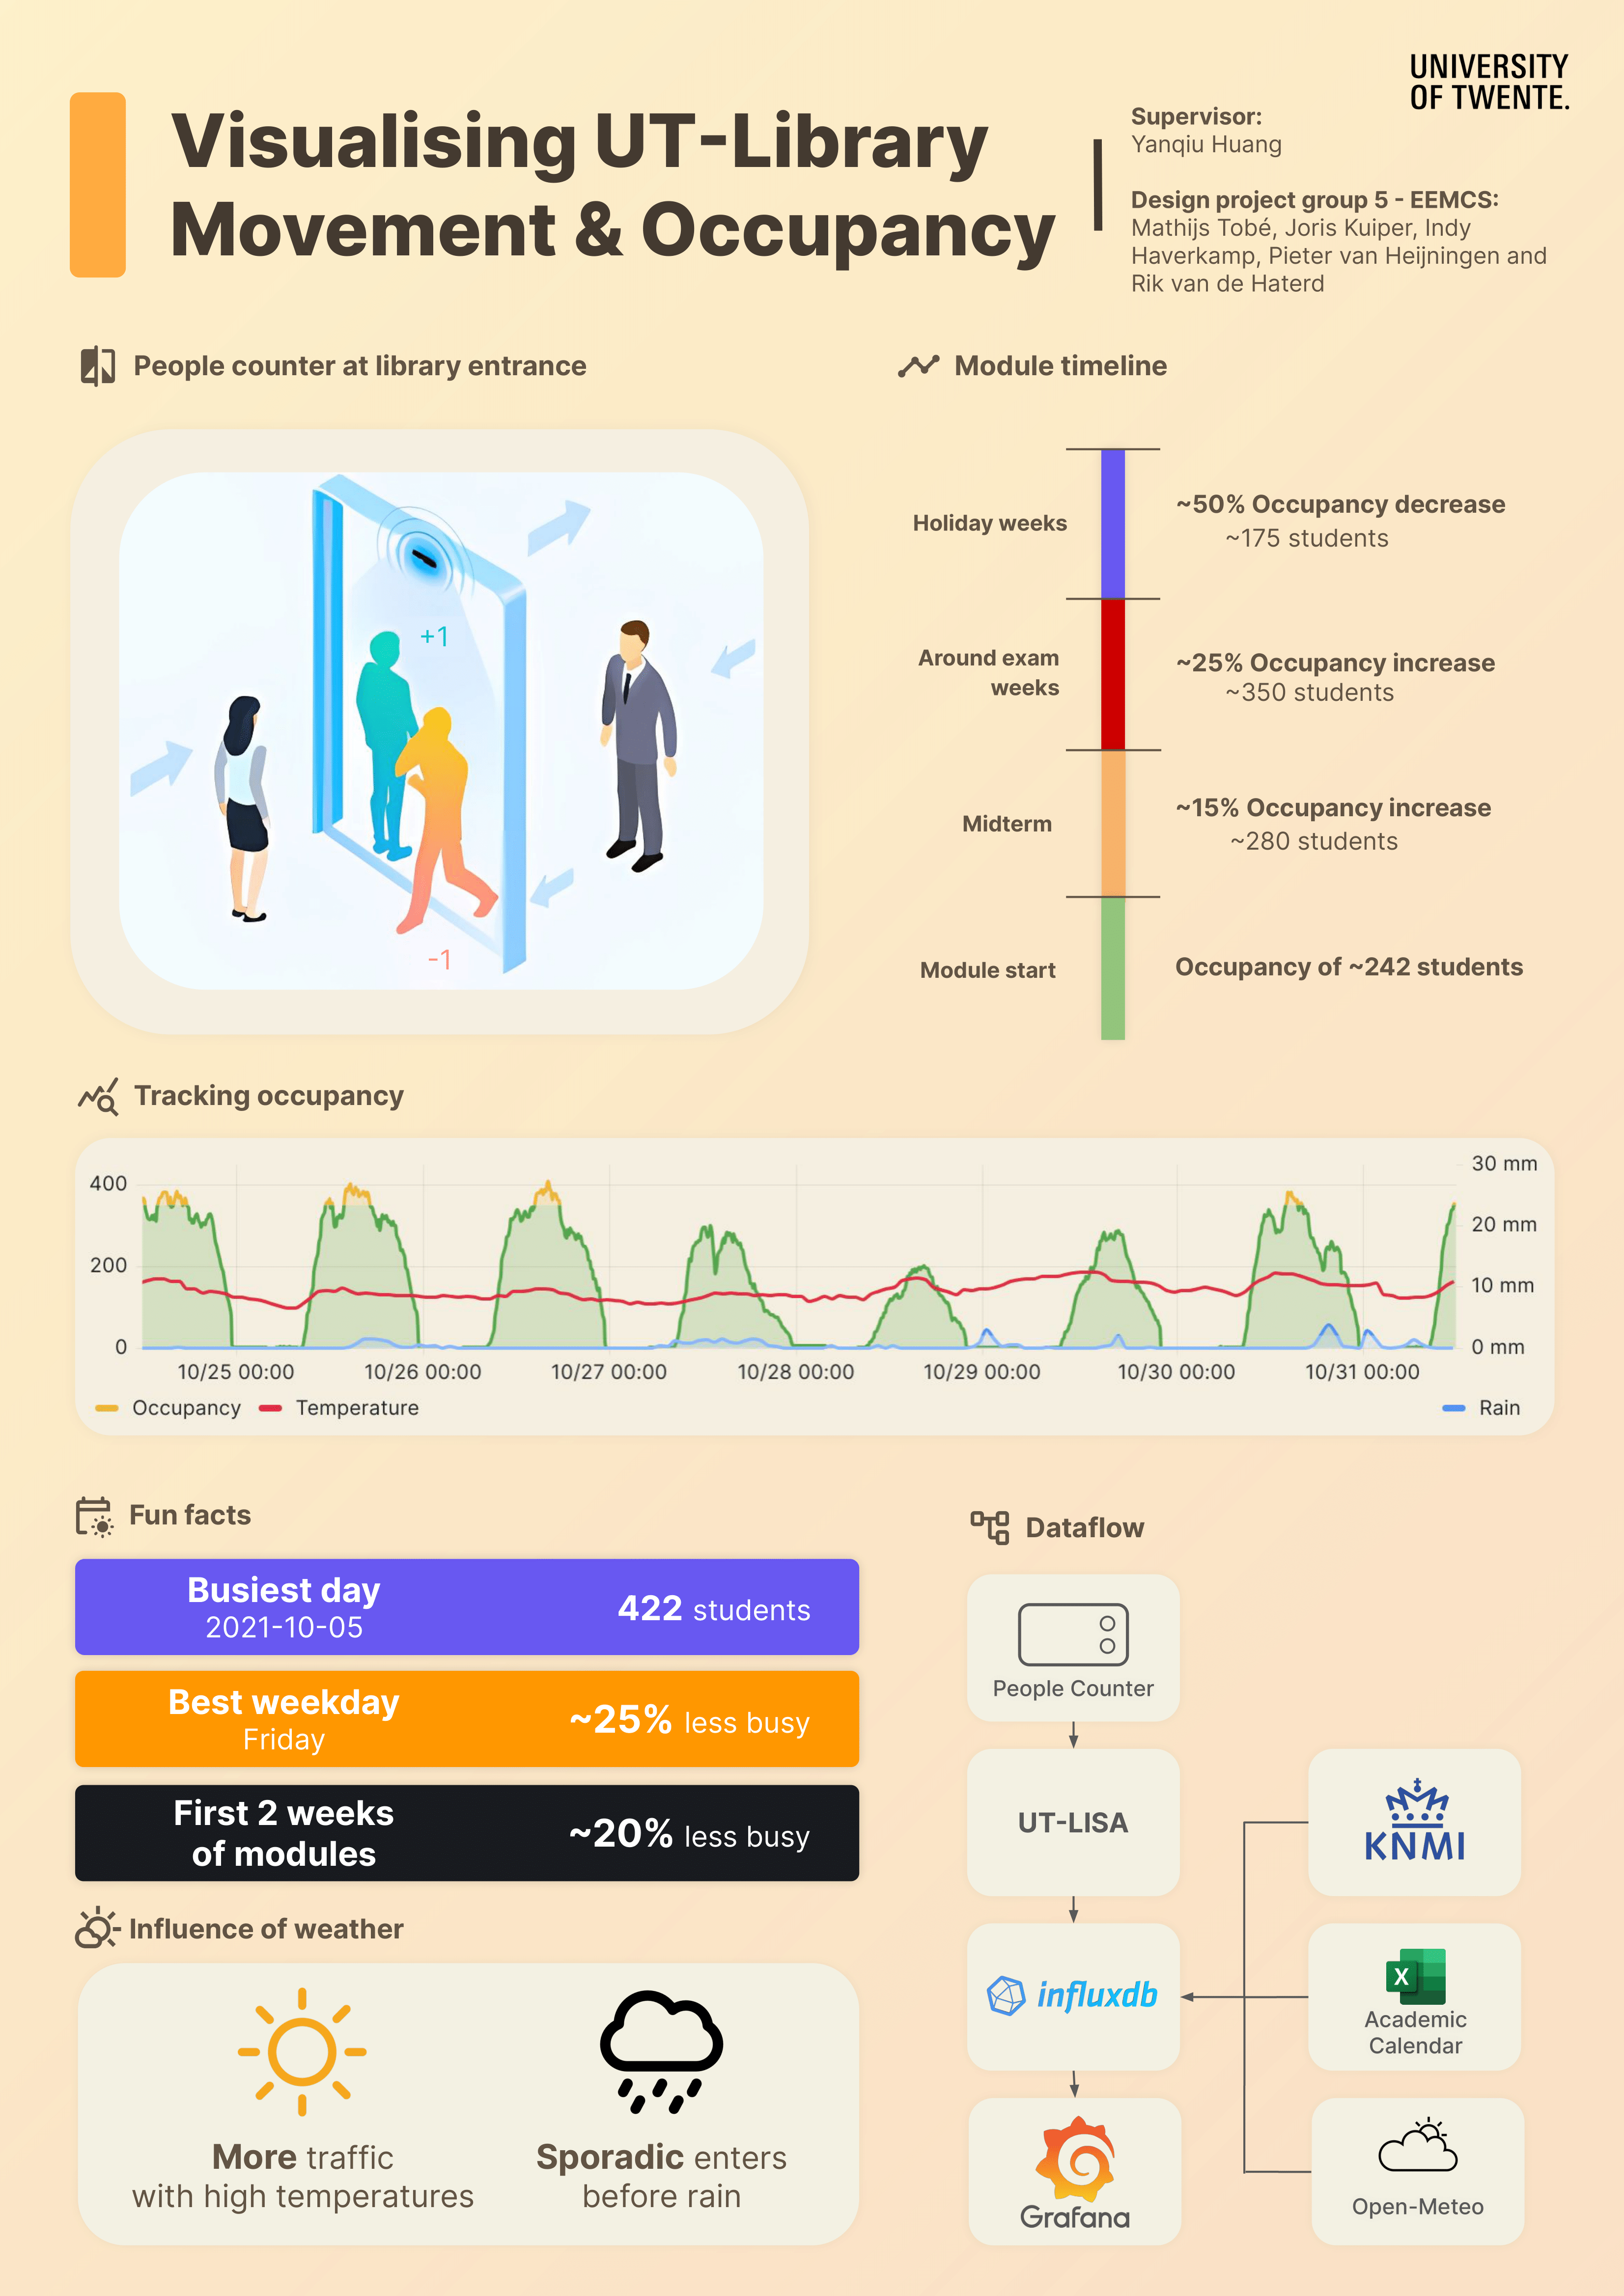
This project designed and implemented a system to visualise and predict occupancy of the UT-Library. It combines data from sensors with weather data and information about the academic year to be able to understand data in context. The combined data is visualised on two Grafana dashboards, one focussed on viewing live data, and the other to gain insight into historic occupancy by enabling comparisons between different kinds of days (holidays, exam week days, etc.), years, and predicting future occupancy.
The CS Design Project module is one of the two final modules of the Bachelor. In the design component of this module, students show that they master the entire design trajectory, from the first informal specification of requirements by a client to the delivery and presentation of a well-documented working product. Projects are submitted by clients from either inside or outside the University. Students perform the project in groups of 3-5 students under the supervision of a teacher from the Department of Computer Science. The supervisor is also the one who assesses the process and products of the group. Project deliverables include a project proposal, a design report, a presentation and a poster.
A snapshot of the dashboard provided to the UT-Library, designed around live data.
A snapshot of the dashboard provided to the UT-Library, designed around historic data.
View the full design report for this project.